if (!require(pak)) {
  install.packages("pak", dependencies = TRUE)
}
if (!require(flextable)) {
  pak::pak("flextable", dependencies = TRUE)
}


# Integrating with AAGIPalettes, AAGIThemes
if (!require(AAGIThemes)) {
  pak::pak("AAGI-AUS/AAGIThemes")
}
if (!require(AAGIPalettes)) {
  pak::pak("AAGI-AUS/AAGIPalettes")
}
if (!require(gapminder)) {
  pak::pak("gapminder")
}

library(ggplot2)
library(AAGIThemes)

# set ggplot2 theme
theme_set(theme_aagi())AAGI
Adam Sparks 
March 27, 2026
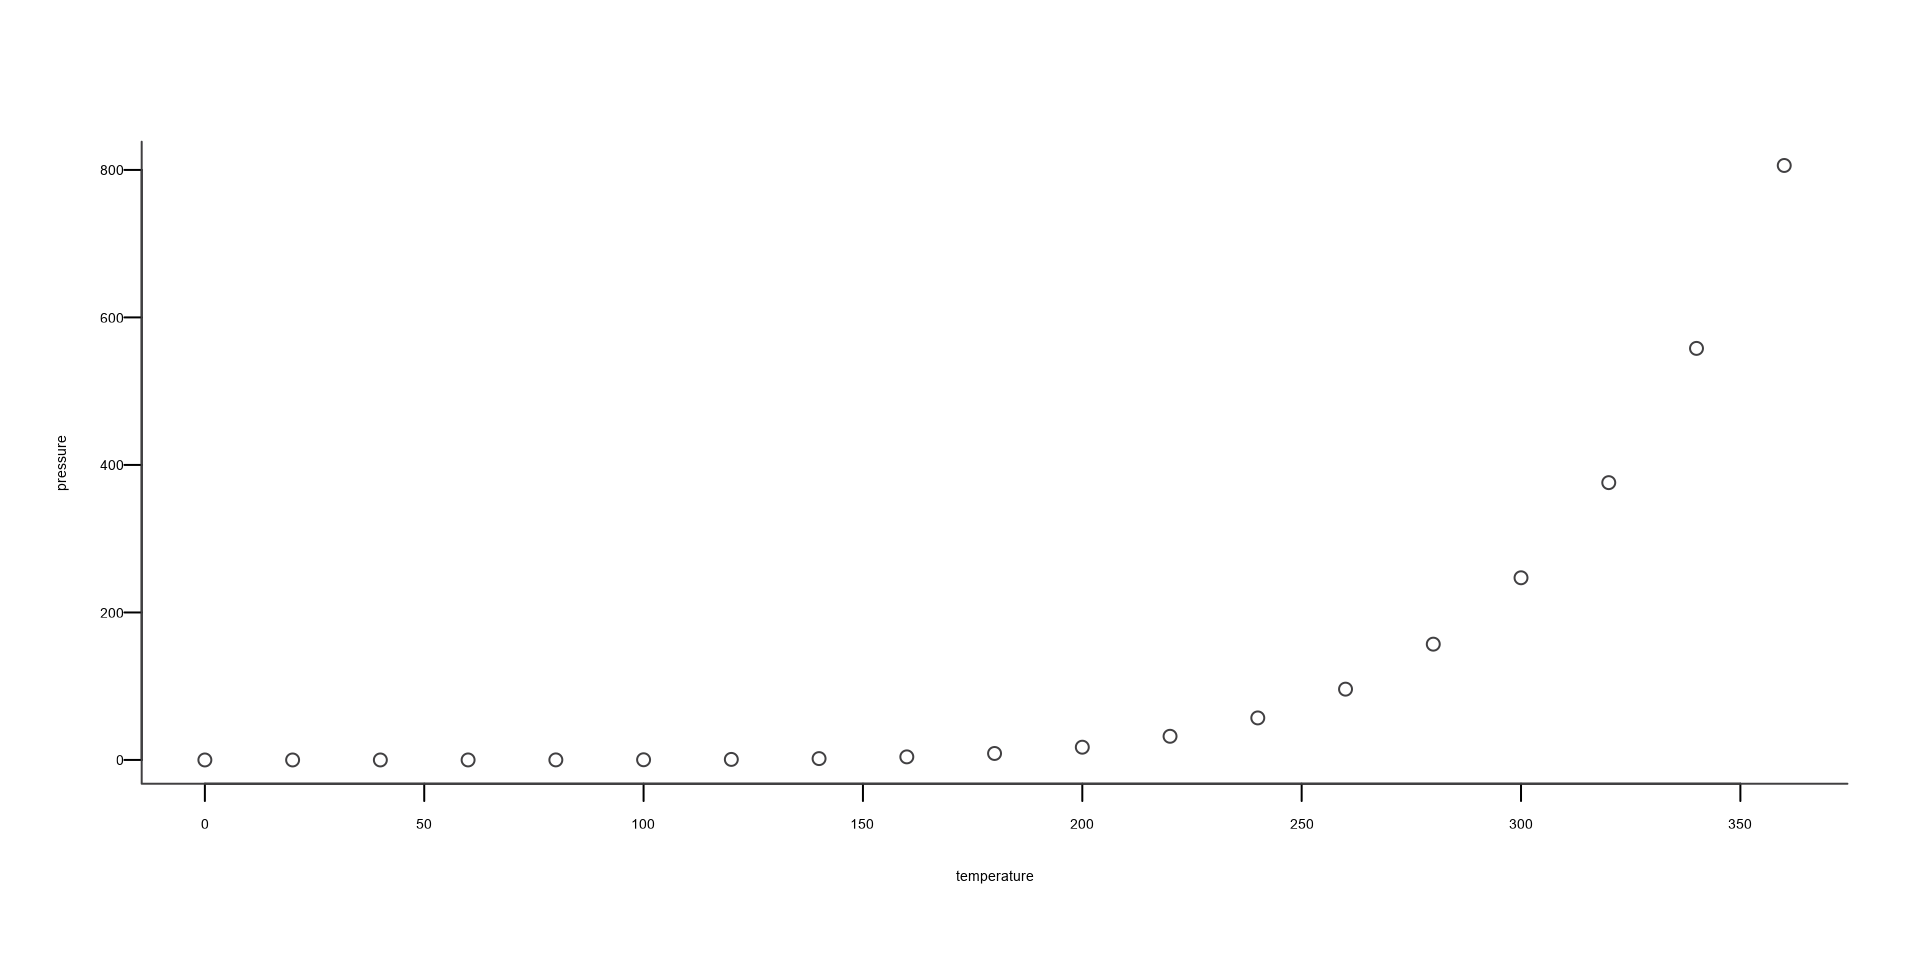
Basic Figures
{AAGIThemes} also provides support for theming basic figures in R, for example.
Figures with {ggplot2}
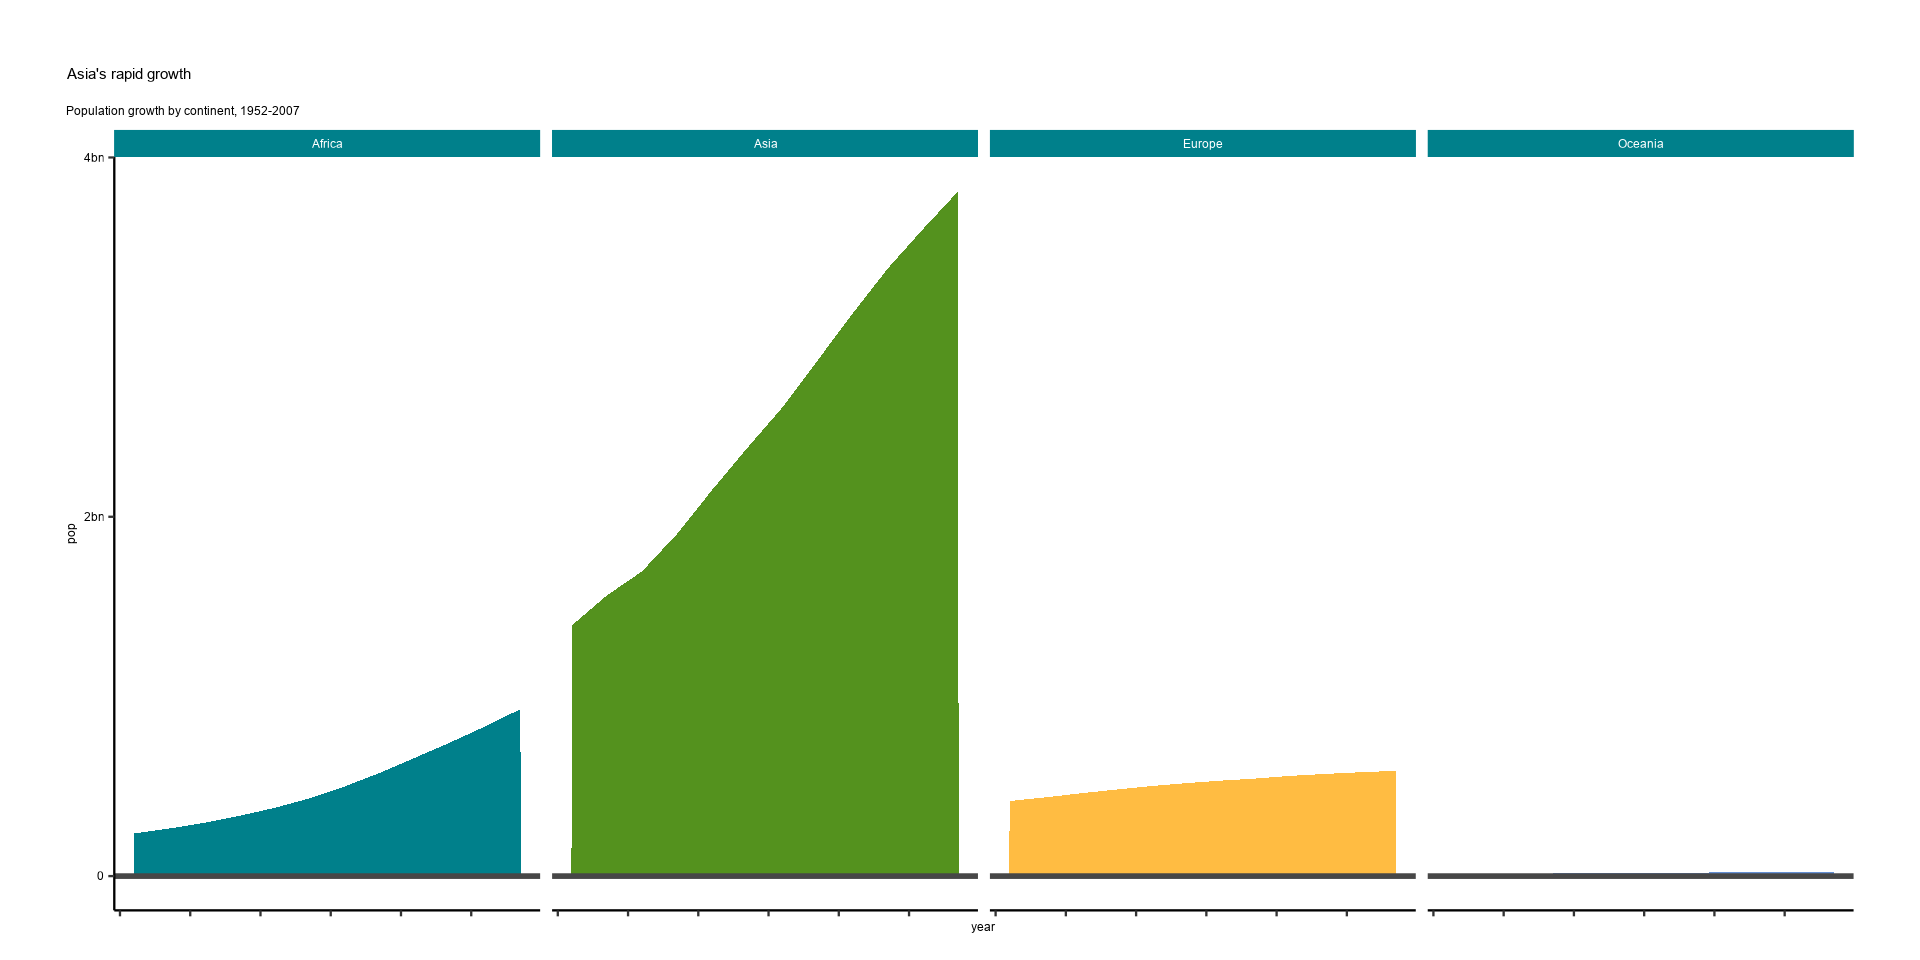
{AAGIThemes} also provides support for theming {ggplot2} outputs in R, for example.
#Prepare data

library(gapminder)
library(dplyr)
library(ggplot2)
library(AAGIThemes)

facet <- gapminder |>
  filter(continent != "Americas") |>
  group_by(continent, year) |>
  summarise(pop = sum(as.numeric(pop)))
#> `summarise()` has grouped output by 'continent'. You can override using the
#> `.groups` argument.

col_values <- c(
  AAGIPalettes::colour_as_hex("AAGI Teal"),
  AAGIPalettes::colour_as_hex("AAGI Green"),
  AAGIPalettes::colour_as_hex("AAGI Yellow"),
  AAGIPalettes::colour_as_hex("AAGI Blue")
)

#Make plot
ggplot() +
  geom_area(data = facet, aes(x = year, y = pop, fill = continent)) +
  scale_fill_manual(values = col_values) +
  facet_wrap(~continent, ncol = 5) +
  scale_y_continuous(
    breaks = c(0, 2000000000, 4000000000),
    labels = c(0, "2bn", "4bn")
  ) +
  theme_aagi() +
  geom_hline(yintercept = 0, linewidth = 1, colour = "#474747") +
  theme(legend.position = "none", axis.text.x = element_blank()) +
  labs(
    title = "Asia's rapid growth",
    subtitle = "Population growth by continent, 1952-2007"
  )