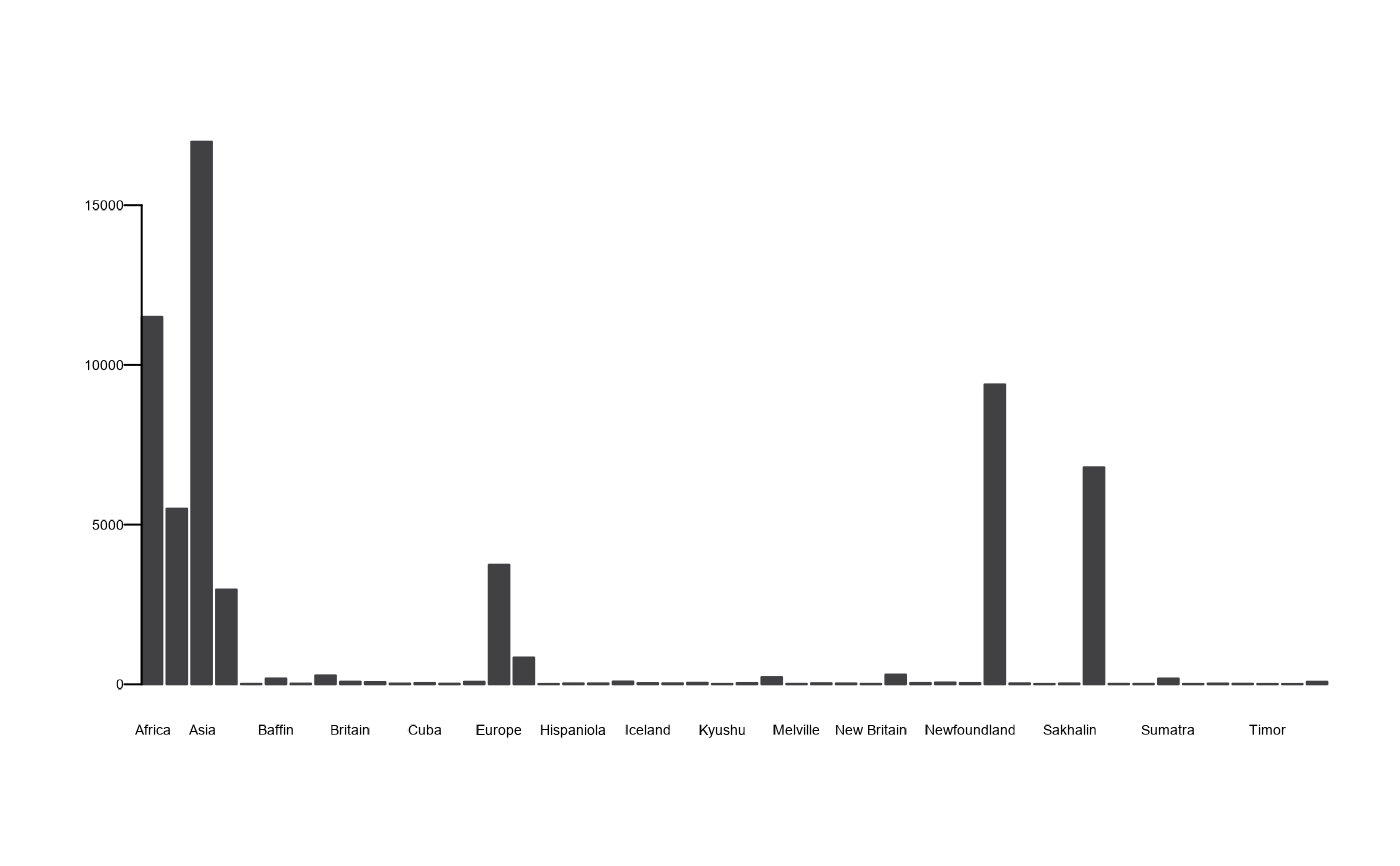
Basic barplots that follow a standard AAGI style
including typography guidelines that uses (hopefully) sensible defaults.
All valid barplot() options are supported through ..., for e.g.,
col to set the colour. Defaults to "AAGI Black", a very dark grey
colour.
Arguments
- height
Either a vector or matrix of values describing the bars which make up the plot. If height is a vector, the plot consists of a sequence of rectangular bars with heights given by the values in the vector. If height is a matrix and beside is
FALSEthen each bar of the plot corresponds to a column of height, with the values in the column giving the heights of stacked sub-bars making up the bar. If height is a matrix and beside isTRUE, then the values in each column are juxtaposed rather than stacked.- ...
Arguments to be passed to methods, such as graphical parameters (see
graphics::par()). The most commonly used argument would beyfor the factor to use for the y-axis,typedescribing what type of plot should be drawn, orcolfor point colour (defaults to AAGI Black), a very dark grey.
Value
A barplot object, returned invisibly (see graphics::barplot()).
See also
graphics::plot()for full documentation of the basic plotting capabilities.plot_aagi, boxplot_aagi, hist_aagi
Other Baseplots:
boxplot_aagi(),
hist_aagi(),
plot_aagi()
Author
Adam Sparks, adam.sparks@curtin.edu.au