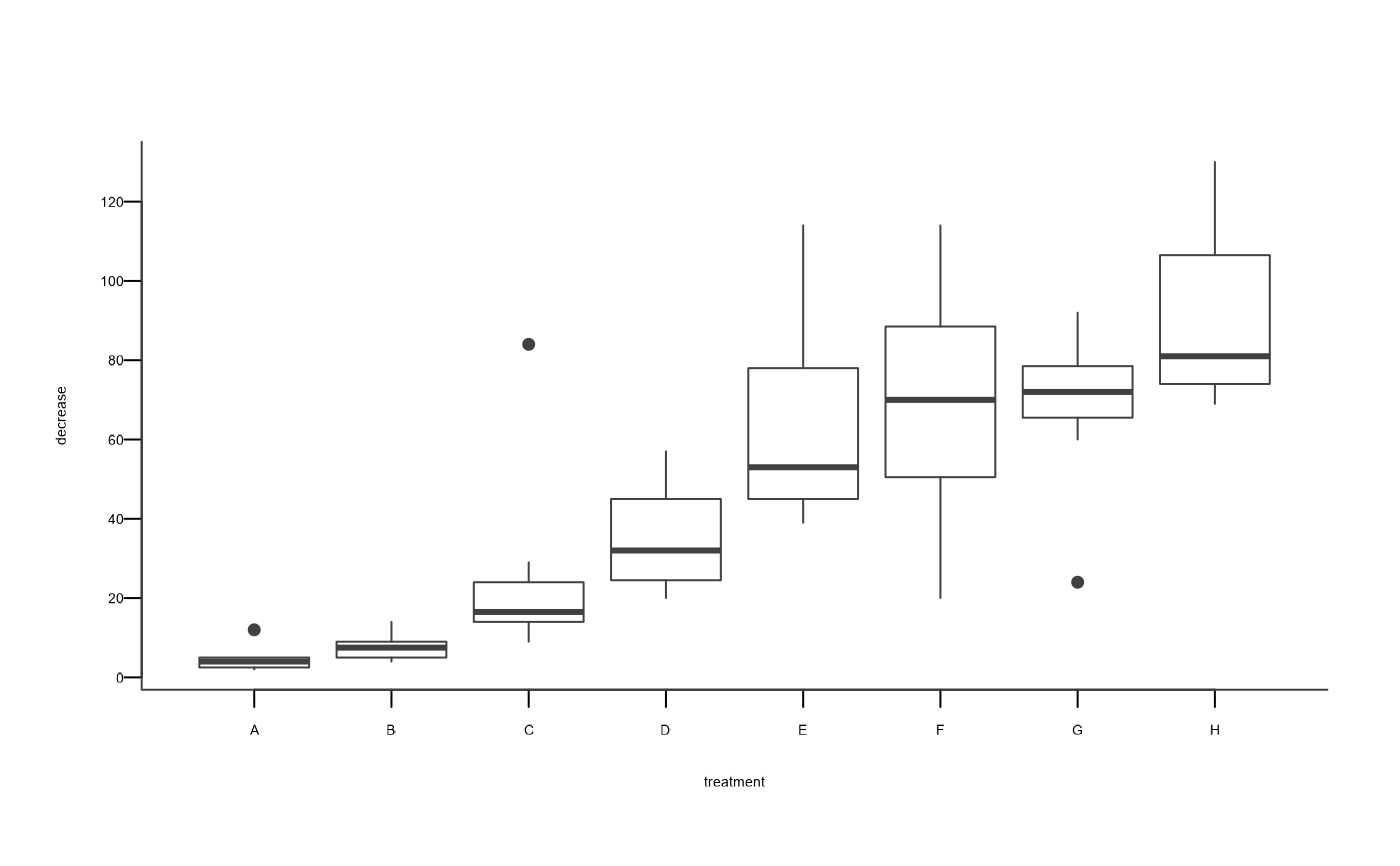
Basic boxplots that follow a standard AAGI style
including typography guidelines that uses (hopefully) sensible defaults.
All valid boxplot() options are supported through ..., for e.g.,
col to set the colour. Defaults to "AAGI Black", a very dark grey
colour.
Arguments
- x
for specifying data from which the boxplots are to be produced. Either a numeric vector, or a single list containing such vectors. Additional unnamed arguments specify further data as separate vectors (each corresponding to a component boxplot).
NAs are allowed in the data.- main
Main title. Optional, if not supplied it will be blank.
- sub
Sub title below x-axis label. Optional, if not supplied it will be blank.
- xlab
X-axis label. Optional.
- ylab
Y-axis label. Optional.
- pch
plotting 'character', i.e., symbol to use.
- ...
Arguments to be passed to methods, such as graphical parameters (see
graphics::par()). The most commonly used argument would beyfor the factor to use for the y-axis,typedescribing what type of plot should be drawn, orcolfor point colour (defaults to AAGI Black), a very dark grey.
Value
A boxplot object, returned invisibly (see graphics::boxplot()).
See also
graphics::boxplot()for full documentation of the basic boxplot capabilities, andgraphics::par()for full documentation ofpch.
graphics::boxplot()for full documentation of the basic plotting capabilities.barplot_aagi, hist_aagi, plot_aagi
Other Baseplots:
barplot_aagi(),
hist_aagi(),
plot_aagi()
Author
Adam Sparks, adam.sparks@curtin.edu.au