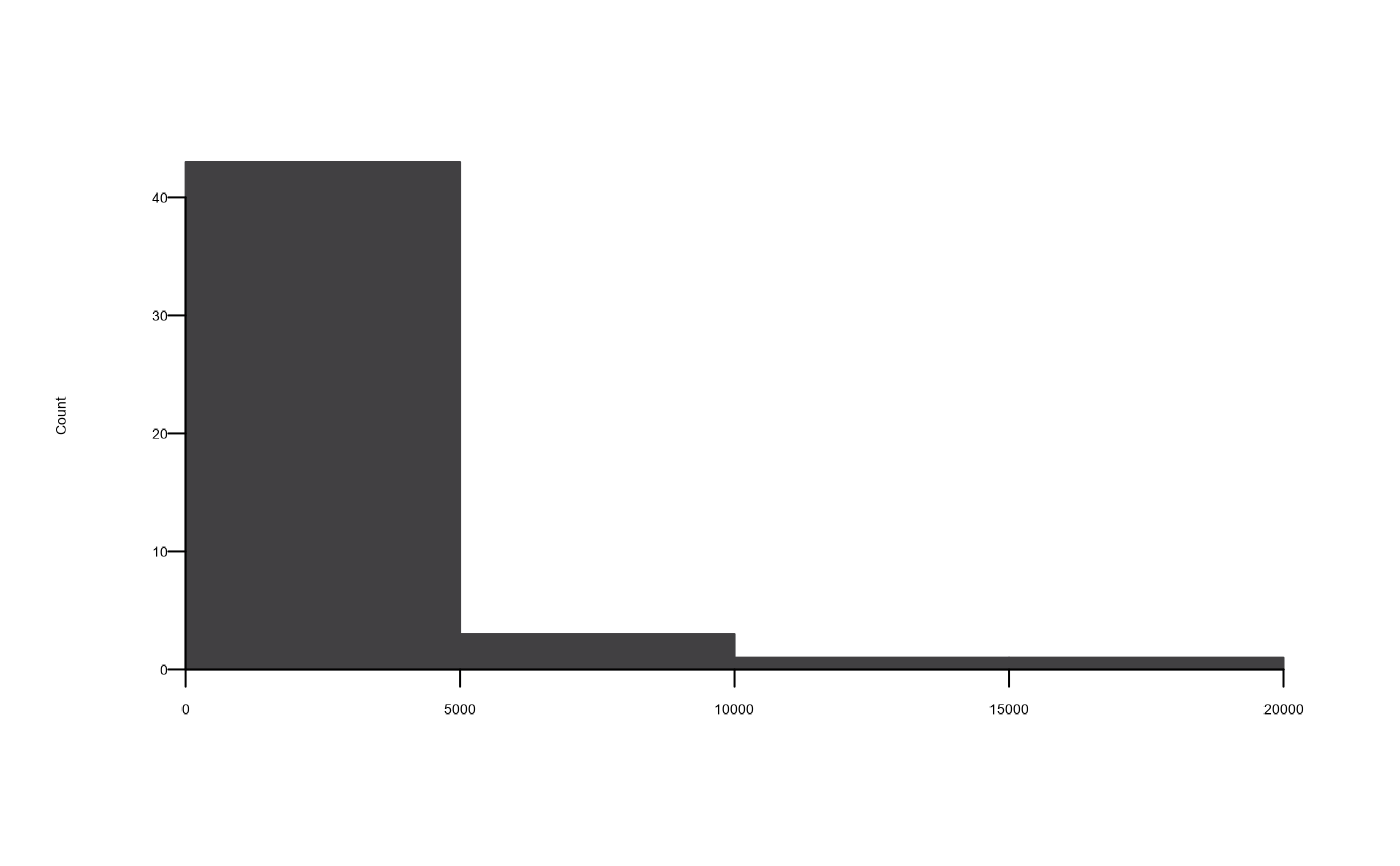
Basic histograms that follow a standard AAGI style
including typography guidelines that uses (hopefully) sensible defaults.
All valid hist() options are supported through ..., for e.g.,
col to set the colour. Defaults to "AAGI Black", a very dark grey colour.
Arguments
- x
A vector of values for which the histogram is desired.
- main
Main title. Optional, if not supplied it will be blank.
- sub
Sub title below x-axis label. Optional, if not supplied it will be blank.
- xlab
X-axis label. Optional, if not supplied will be an empty string.
- ylab
Y-axis label. Optional, if not supplied will default to "Count".
- breaks
One of "scott" (default), "fd", "sturges" (R's default), or "exact" (fixed bin width of 1 for integer. counts).
- ...
Arguments to be passed to methods, such as graphical parameters (see
graphics::par()). The most commonly used argument would beyfor the factor to use for the y-axis,typedescribing what type of plot should be drawn, orcolfor point colour (defaults to AAGI Black), a very dark grey.
Value
A histogram object, returned invisibly (see graphics::hist()).
References
Scott, D.W. (1979) On optimal and data-based histograms. Biometrika, 66, 605–610.
Hyndman, R.J., The Problem with Sturges' Rule for Constructing Histograms, 1995, Monash University, https://www.robjhyndman.com/papers/sturges.pdf.
See also
graphics::hist()for full documentation of the basic histogram capabilities.barplot_aagi, boxplot_aagi, plot_aagi
Other Baseplots:
barplot_aagi(),
boxplot_aagi(),
plot_aagi()
Author
Adam Sparks, adam.sparks@curtin.edu.au