Basic plot that follow a standard AAGI style
including typography guidelines that uses (hopefully) sensible defaults.
All valid plot() options are supported through ..., for e.g.,
col to set the colour. Defaults to "AAGI Black", a very dark grey
colour.
Arguments
- x
the coordinates of points in the plot. Alternatively, a single plotting structure, function or any R object with a plot method can be provided.
- y
The y coordinates of points in the plot, optional. If
yisNULL,xis assumed to describe theyvalues, and an index is used forx.- ...
Arguments to be passed to methods, such as graphical parameters (see
graphics::par()). The most commonly used argument would beyfor the factor to use for the y-axis,typedescribing what type of plot should be drawn, orcolfor point colour (defaults to AAGI Black), a very dark grey.
Value
A plot object, returned invisibly (see graphics::plot()).
See also
graphics::plot()for full documentation of the basic plotting capabilities.barplot_aagi, boxplot_aagi, hist_aagi
Other Baseplots:
barplot_aagi(),
boxplot_aagi(),
hist_aagi()
Author
Adam Sparks, adam.sparks@curtin.edu.au
Examples
library(datasets)
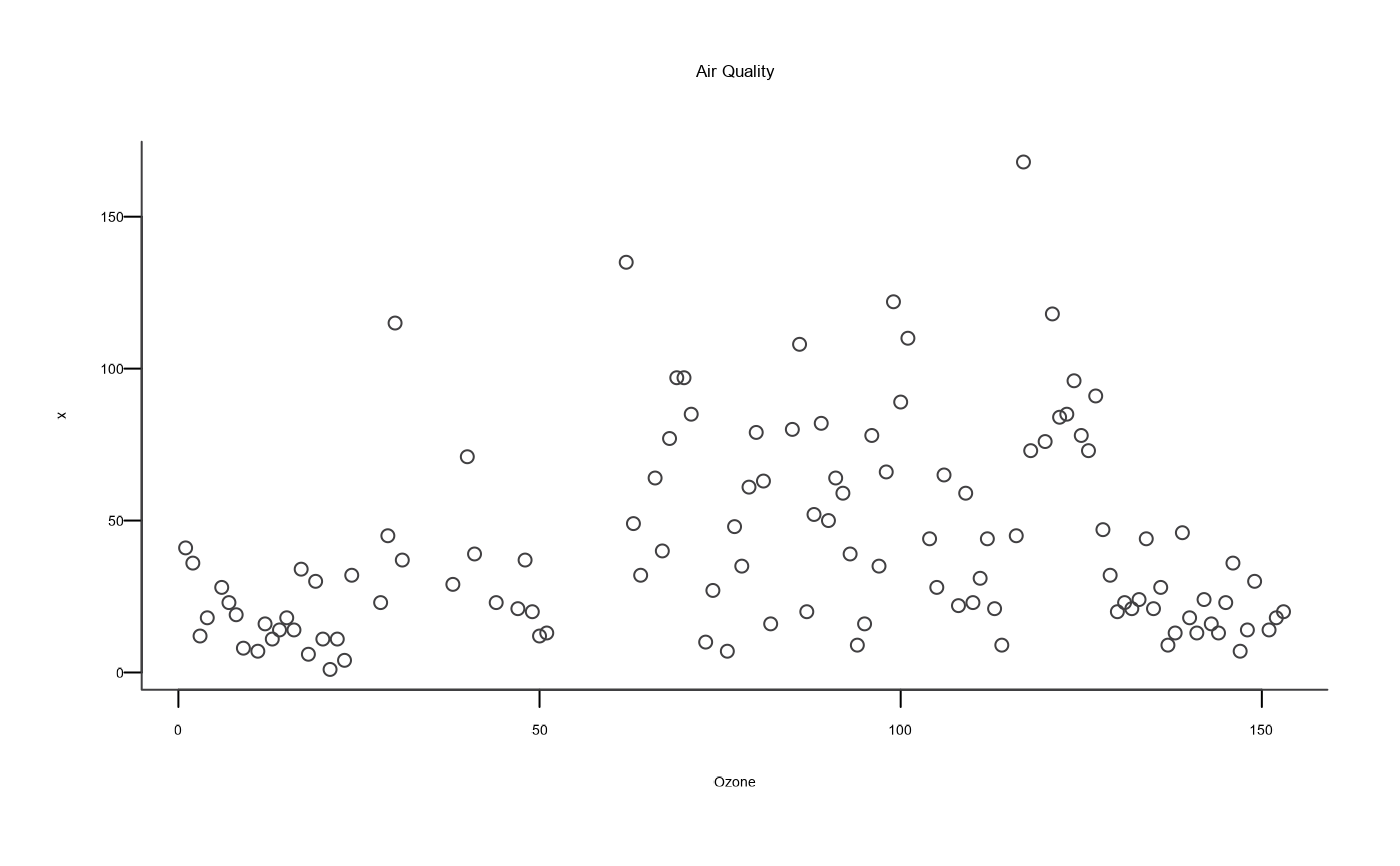
plot_aagi(airquality$Ozone,
main = "Air Quality",
xlab = "Ozone"
)
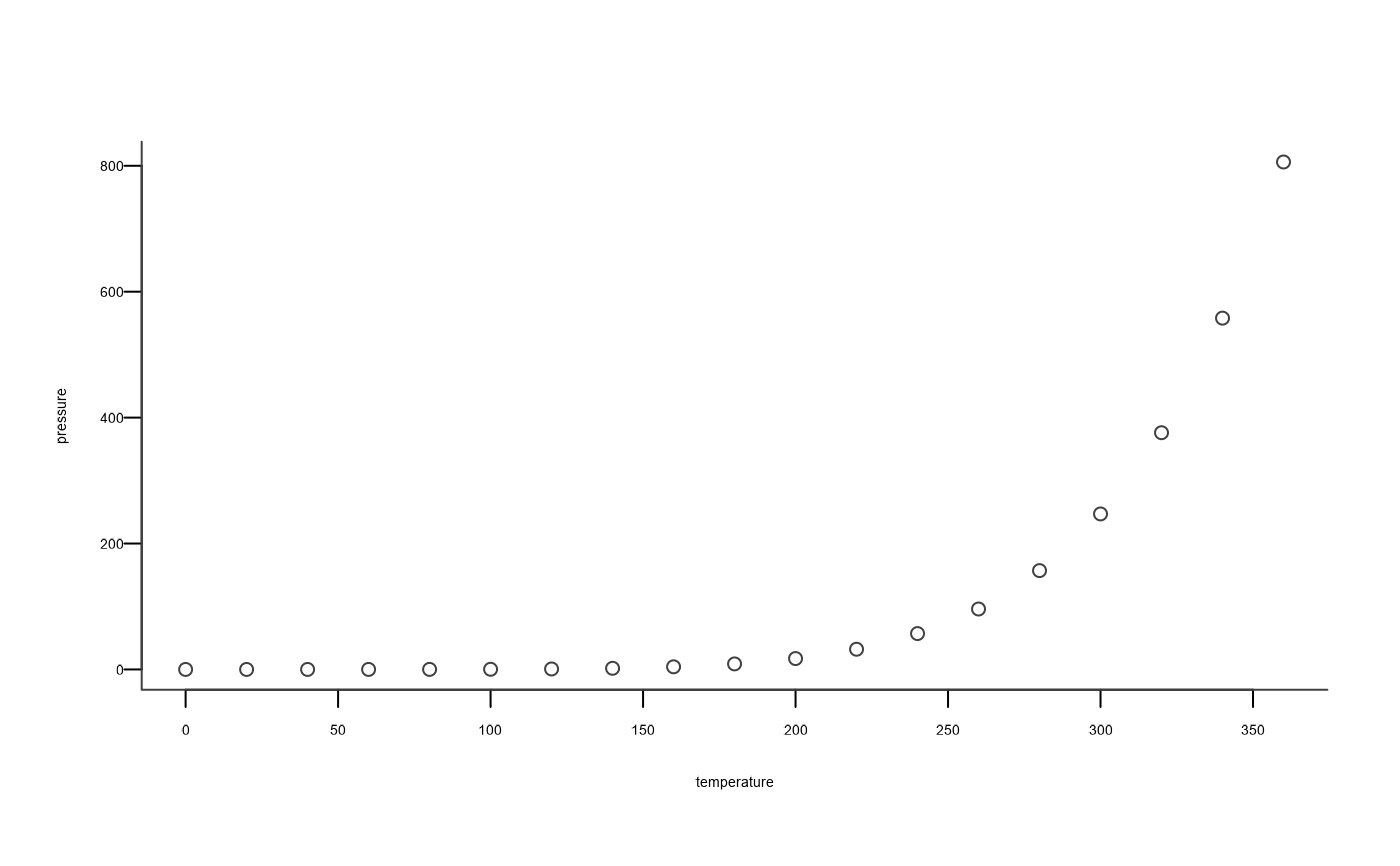
 plot_aagi(pressure)