A ggplot2 Theme Using a Unified AAGI Style and Typography for Plots
Source:R/theme_aagi.R
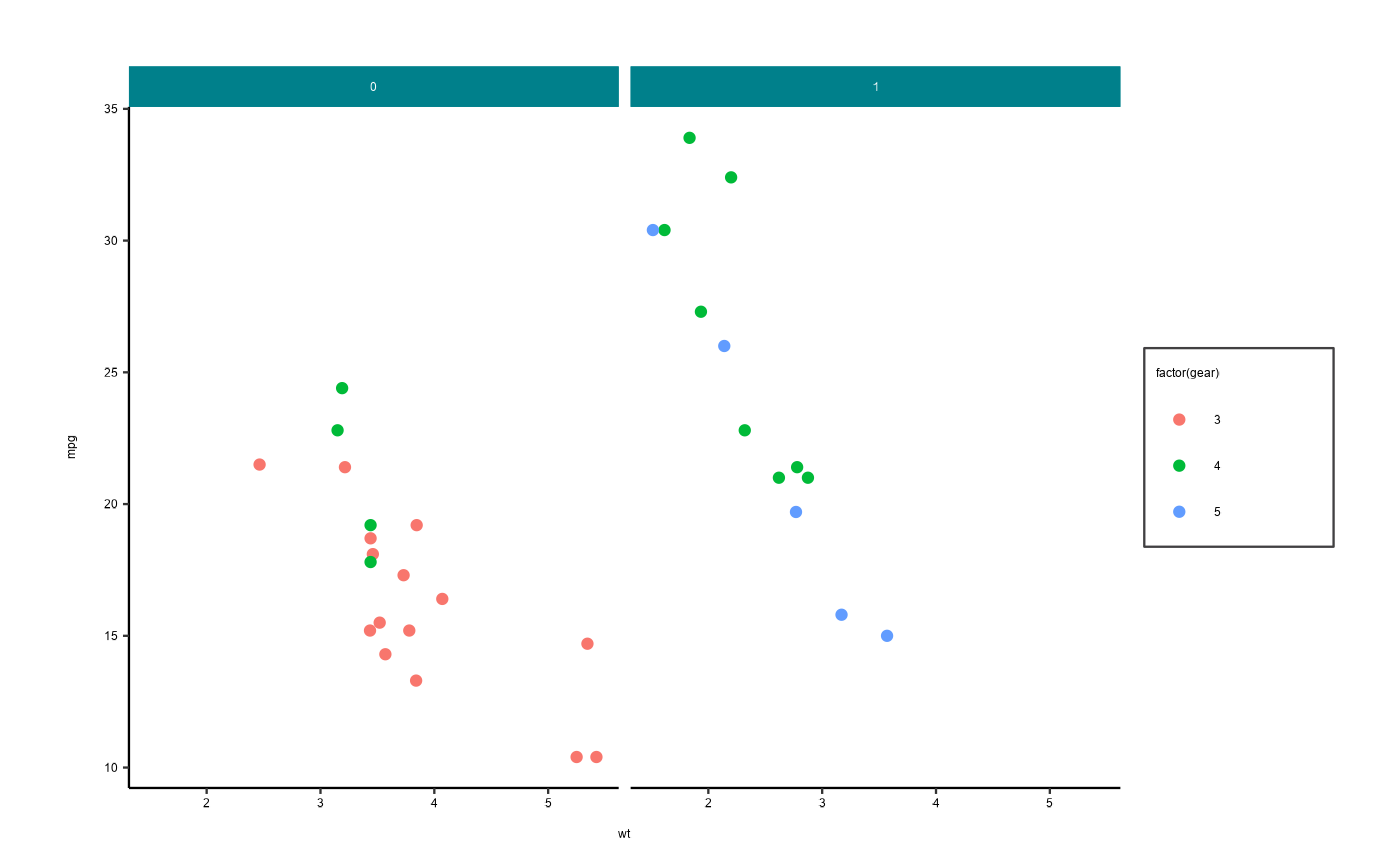
theme_aagi.RdThis theme follows a standard AAGI style including typography guidelines that uses (hopefully) sensible defaults for ggplot2 graphics.
Usage
theme_aagi(
  base_size = 12,
  major_grid = FALSE,
  minor_grid = FALSE,
  border = FALSE,
  showtext_auto = TRUE,
  ...
)
Arguments
- base_size
Numeric. The figure's base size, set to 12 by default. For presentations using a largerbase_sizewill make the fonts larger and more suitable for presentation slides, e.g.,base_size = 24.- major_grid
Boolean. Include major gridlines in the panel. Defaults toFALSE.- minor_grid
Boolean. Include minor gridlines in the panel. Defaults toFALSE.- border
Boolean. Include a border around the figure on all four sides. Defaults toFALSE.- showtext_auto
Boolean. IfTRUE, enableshowtext::showtext_auto()that provides full AAGI font support. Defaults toTRUE.Important:
showtext::showtext_auto()changes global rendering behaviour for the entire R session/device. This can affect subsequent plots (including non-AAGIThemes plots) until it is disabled. However, since it is anticipated that this theme will only ever be used for official AAGI work, this seems unlikely to be an issue.To undo, call
showtext_aagi_off().- ...
Other arguments as passed along to
ggplot2::theme().
Author
Adam Sparks, adam.sparks@curtin.edu.au
Examples
library("ggplot2")

p <- ggplot(mtcars) +
  geom_point(aes(wt, mpg)) +
  theme_aagi(showtext_auto = TRUE)

p


# Disable global showtext auto afterwards (recommended)
showtext_aagi_off()
# Disable global showtext auto afterwards (recommended)
showtext_aagi_off()