GGA training session 3 – Trial Protocols and Best Data Practices
September 5, 2024
Don’t Optimise for Convenience
Don’t Optimise for Convenience

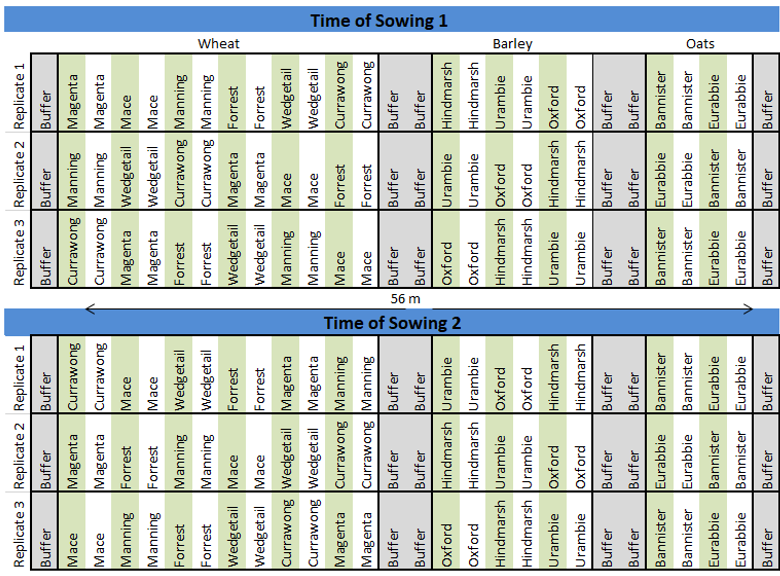
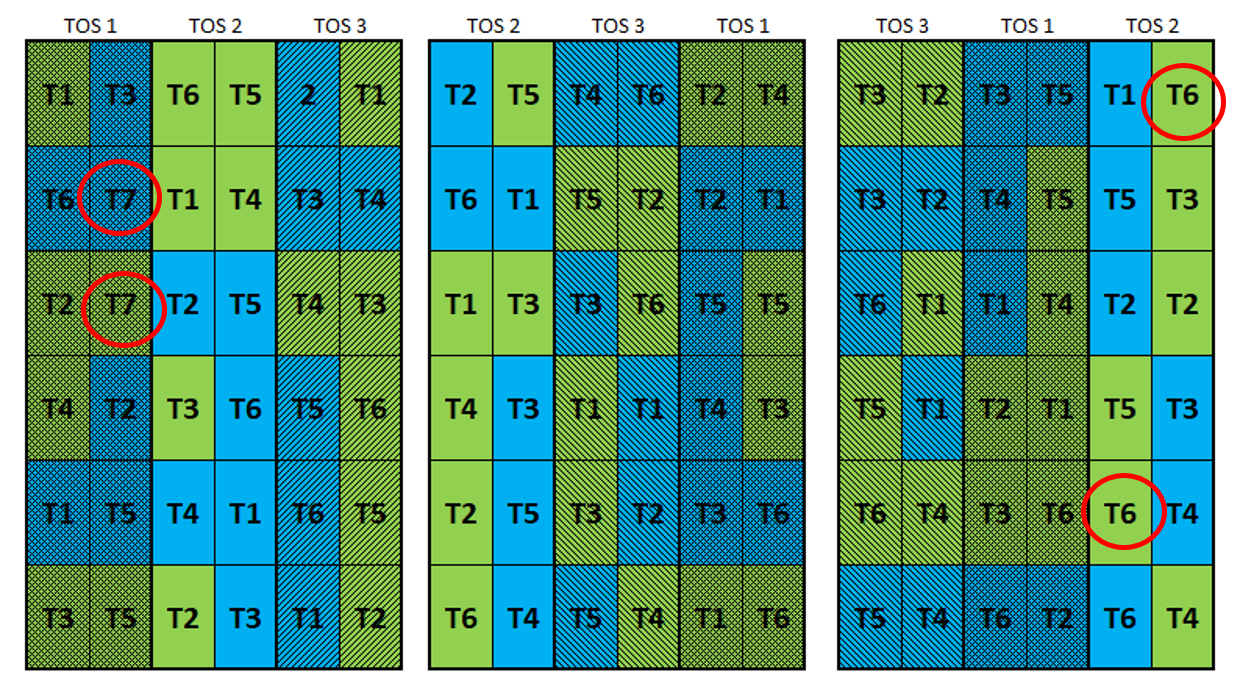
Ensure the Design is Recorded Correctly
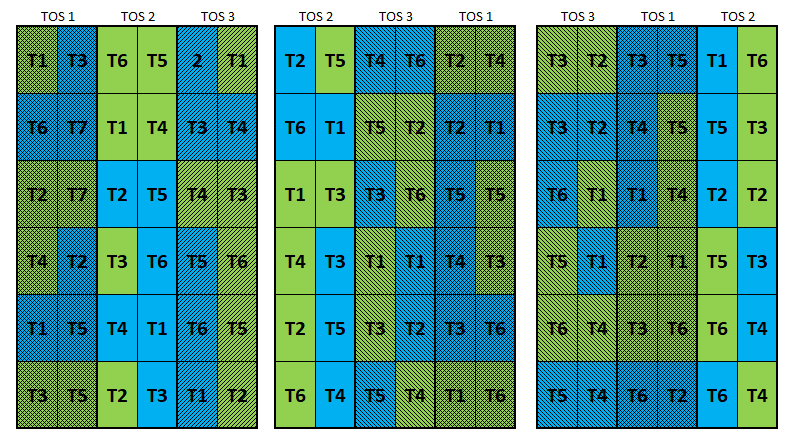
Ensure the Design is Recorded Correctly
Controlling Measurement Error and Uncertainty

Controlling Measurement Error and Noise
Controlling Measurement Error and Noise

Source: Dr Karyn Reeves, SAGI-West
Controlling Measurement Error and Noise


Always Provide the Full Set of Raw Data

Source: Dr Karyn Reeves, SAGI-West
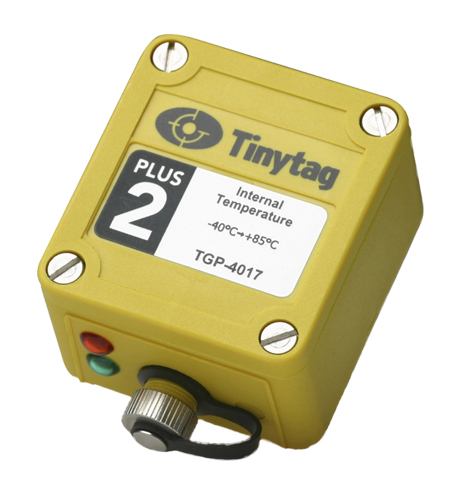
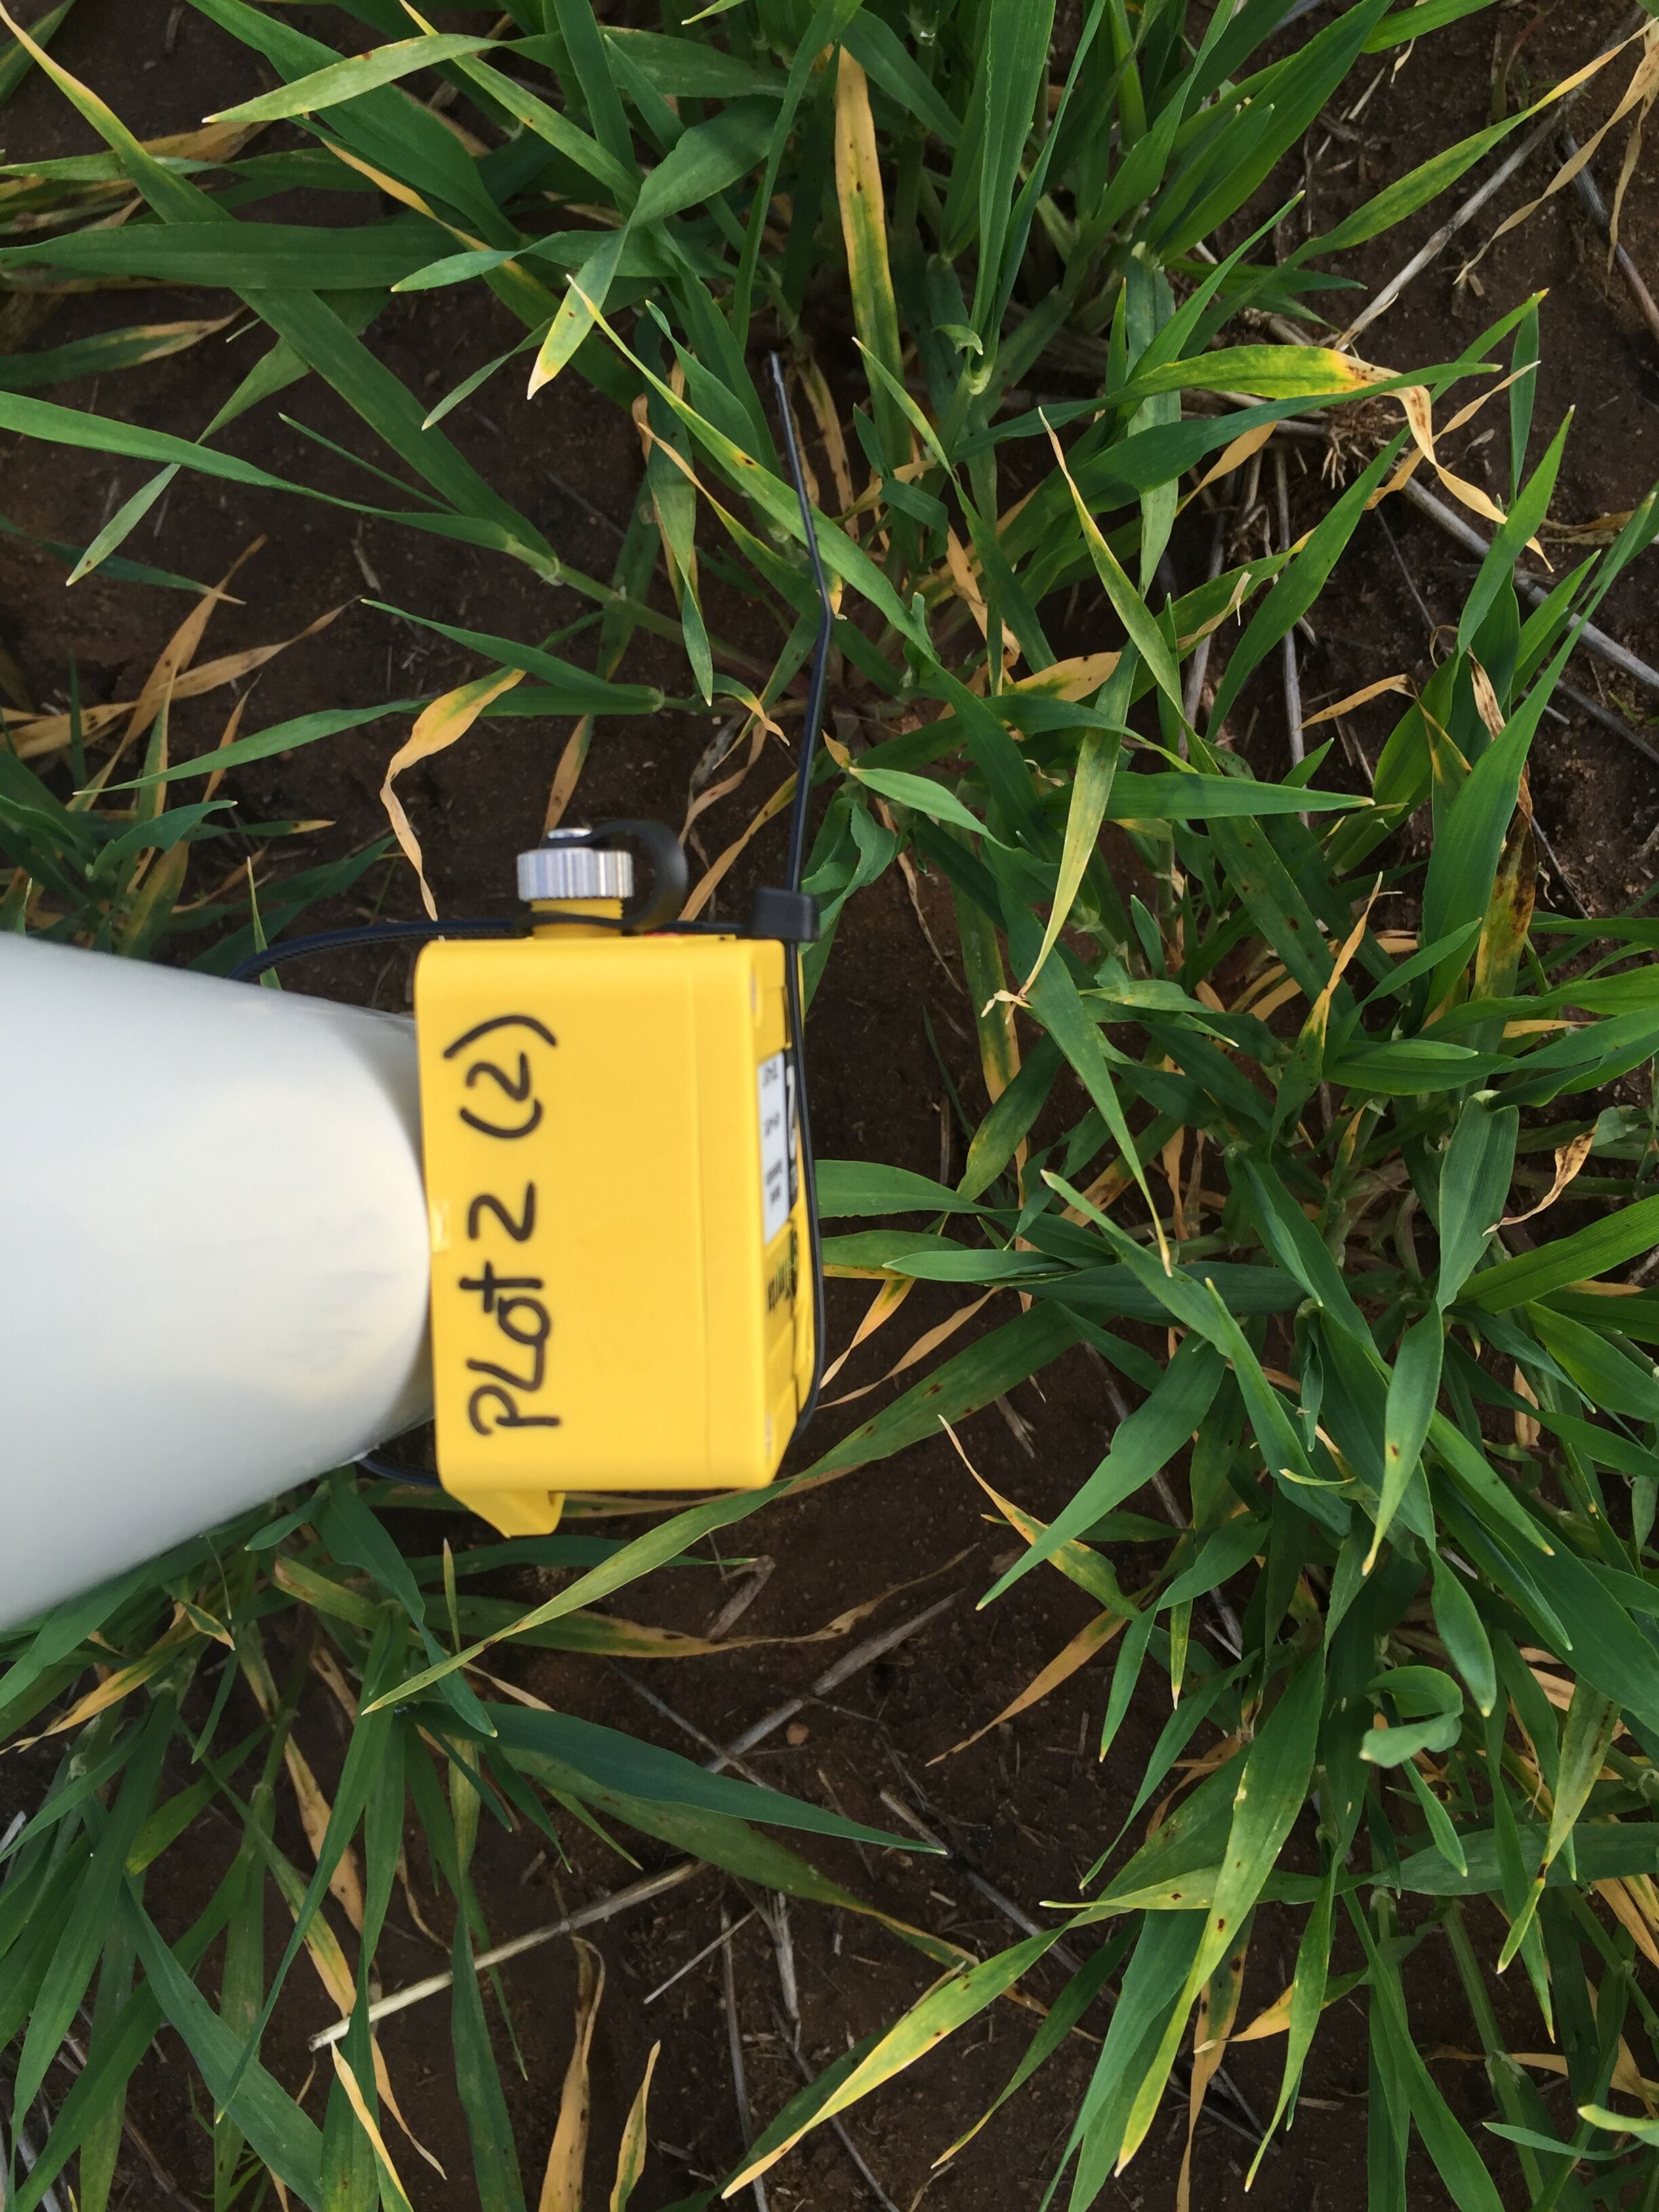
Record Ancillary Details

Source: Dr Ben Biddulph, DPIRD
Check Your Data

Source: Dr Karyn Reeves, SAGI-West
Best Practices to Follow
All columns supplied with the trial design should be retained
Every plot needs a unique identifier (e.g., plot number)
Avoid copy-paste (easy to introduce errors)
Ensure embedded equations reference the correct columns
- Or better yet, don’t do calculations in the spreadsheet at all

Write Dates as YYYY-MM-DD (ISO 8601)
A spreadsheet with inconsistent date formats. This spreadsheet does not adhere to recommendations for consistency of date format. From Broman and Woo (2018). Also see https://xkcd.com/1179.
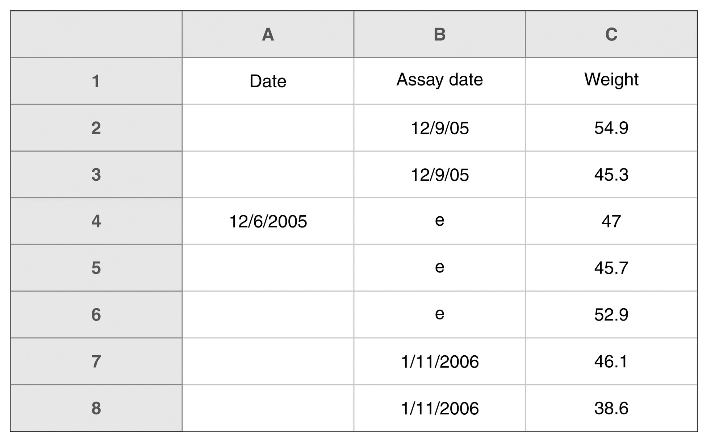
No Empty Cells
Examples of spreadsheets that violate the no empty cells
recommendation. (a) A spreadsheet where only the first of several repeated values was included. (b) A spreadsheet with a complicated layout and some implicit column headers, from Broman and Woo (2018).
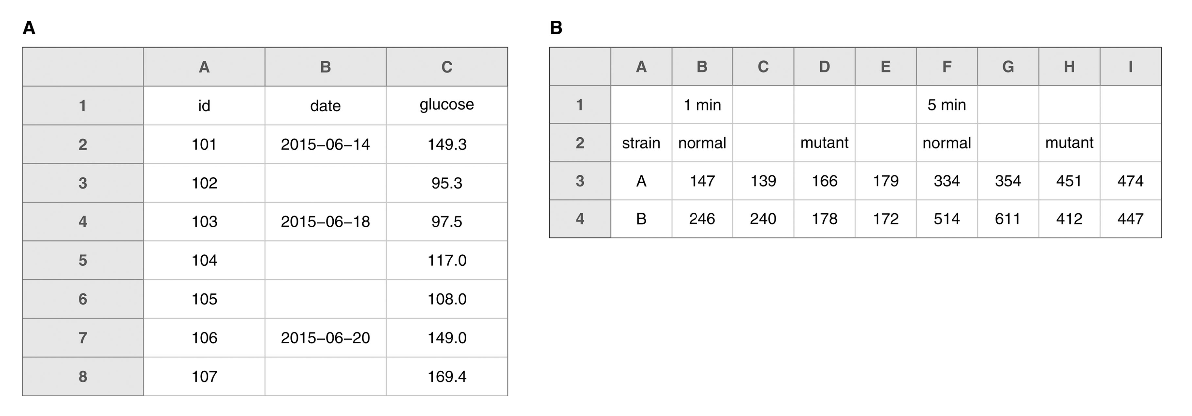
Make It a Rectangle
Examples of spreadsheets with nonrectangular layouts. These layouts are likely to cause problems in analysis, from Broman and Woo (2018).
Example A, what not to do.
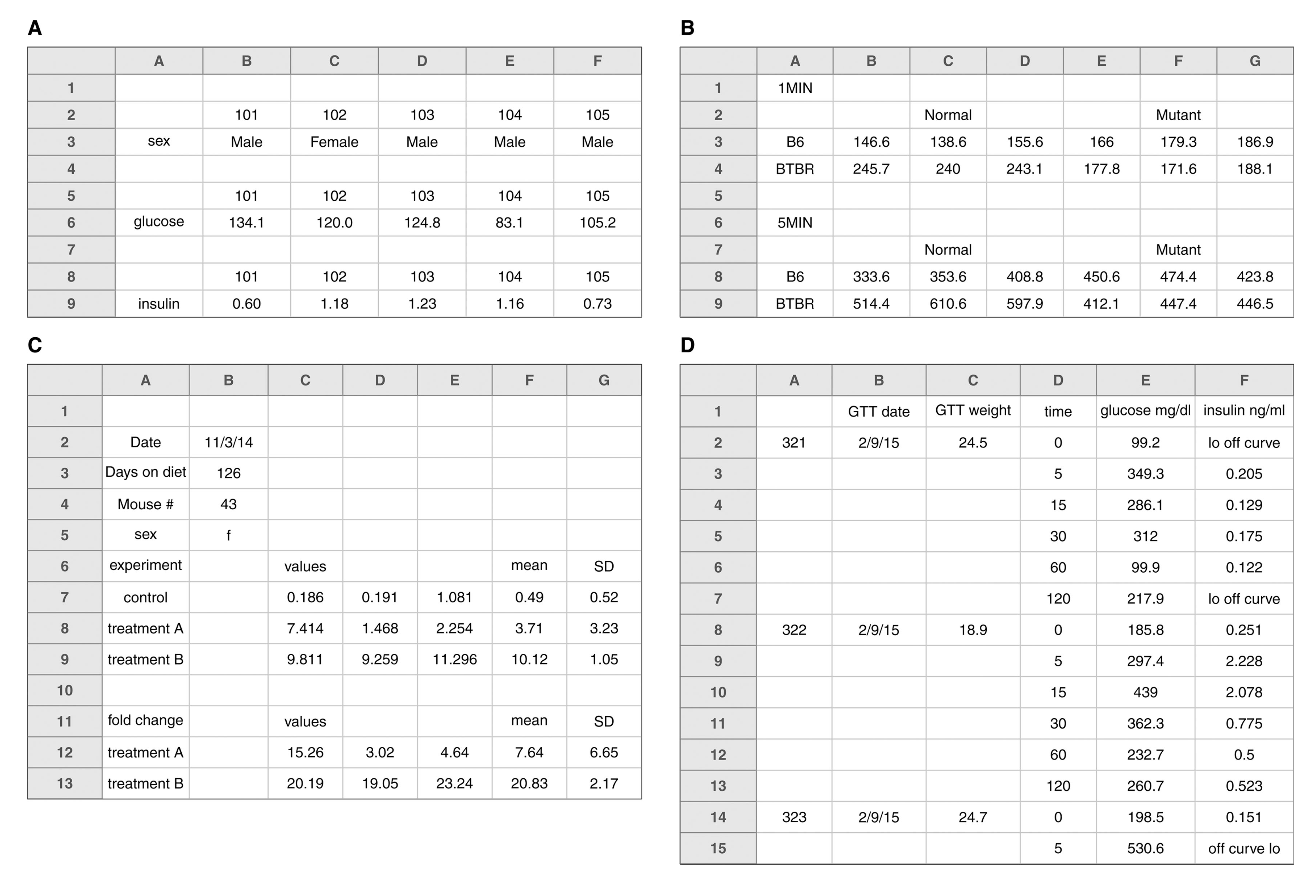
Make It a Rectangle
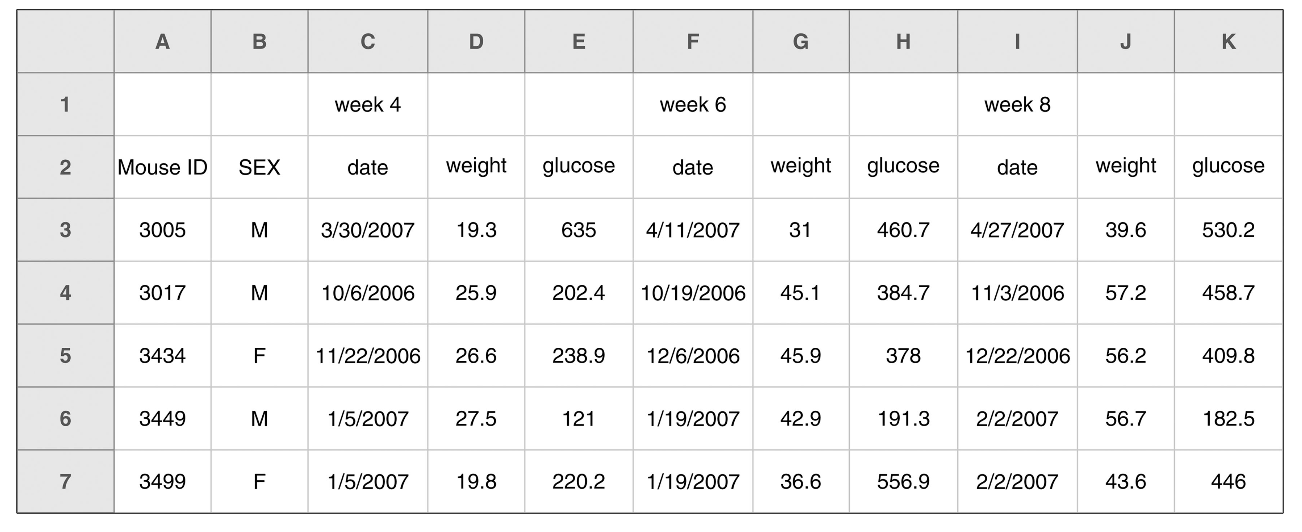
A spreadsheet with two header rows. It is better to have a single header row, from Broman and Woo (2018).
Example B, what not to do.
Make It a Rectangle

An example spreadsheet of the previous example’s data in a rectangular layout, from Broman and Woo (2018).
Yes, do this!
Create a Data Dictionary

An example data dictionary, from Broman and Woo (2018).
Do Not Use Colour as Data
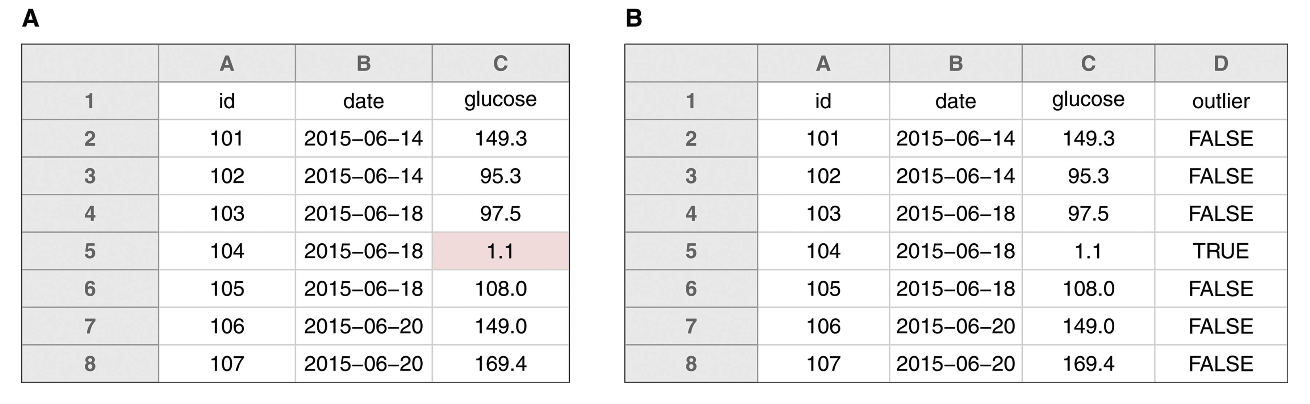
Highlighting in spreadsheets.(a) A potential outlier indicated by highlighting the cell.(b) The preferred method for indicating outliers, via an additional column, from Broman and Woo (2018).
Save Data in Plain Text Files (e.g., CSV)
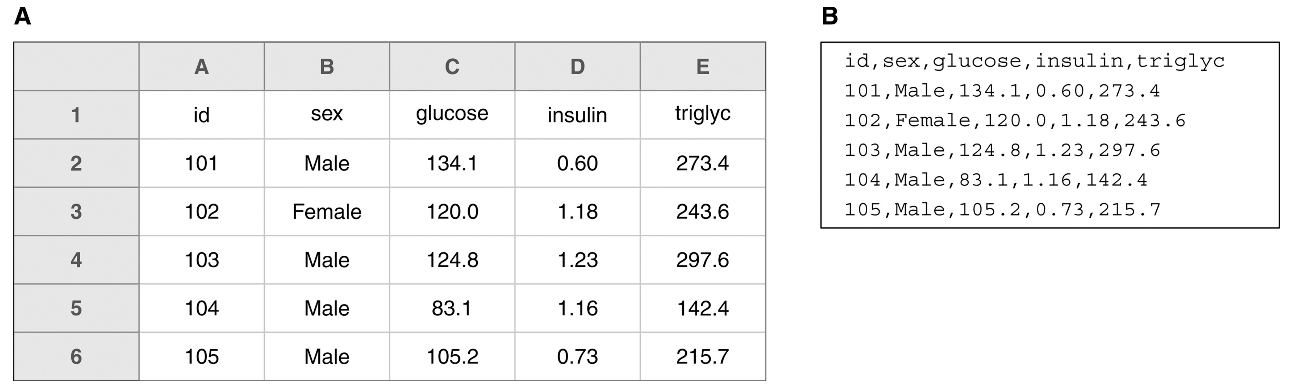
(a) An example spreadsheet. (b) The same data as a plain text file in CSV format, from Broman and Woo (2018).
References
![]()