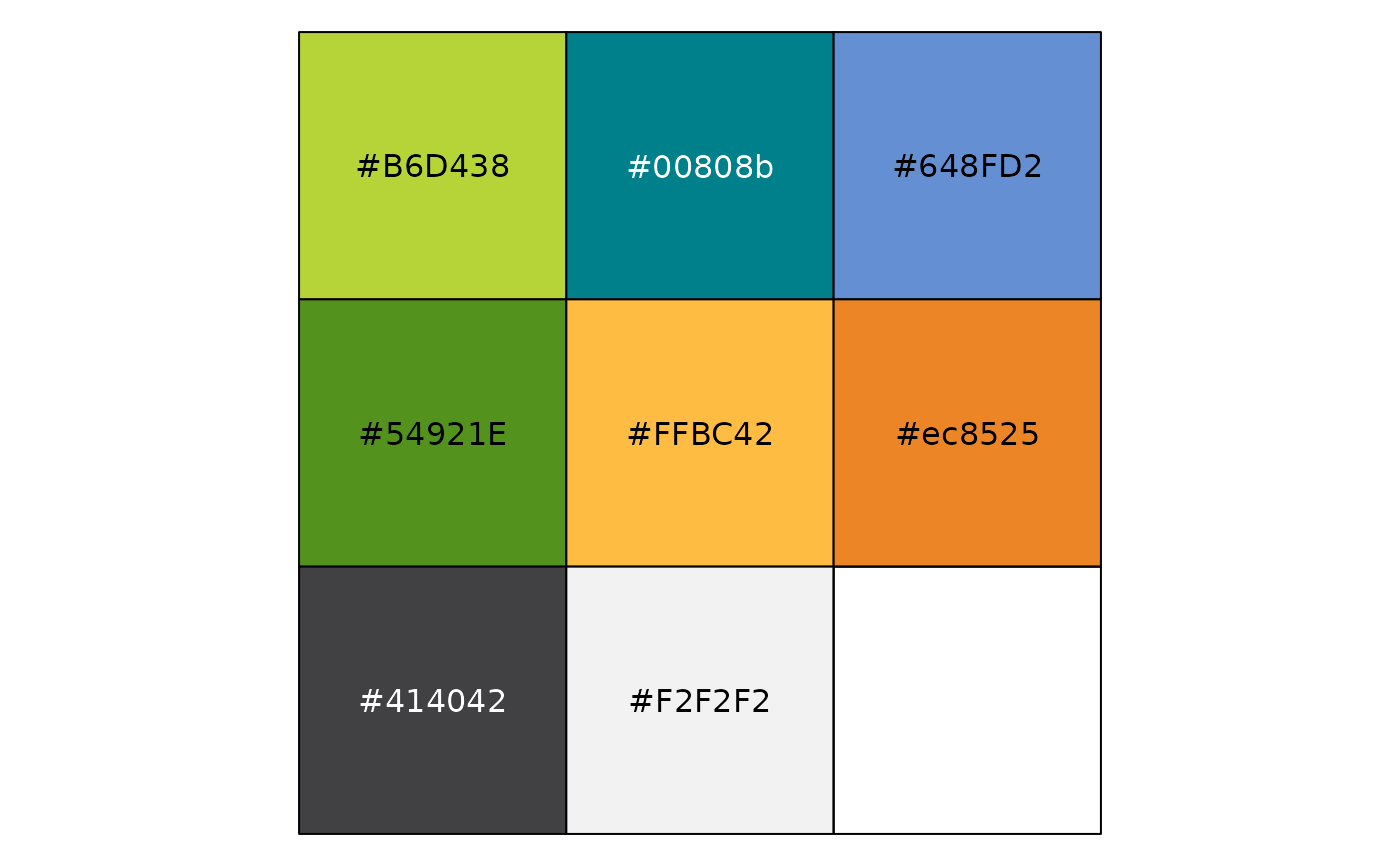
A quick and dirty way to show AAGI colours in a palette plot.
Arguments
- name
Either
aagi_colours(default) or a palette name from the lists below.- n
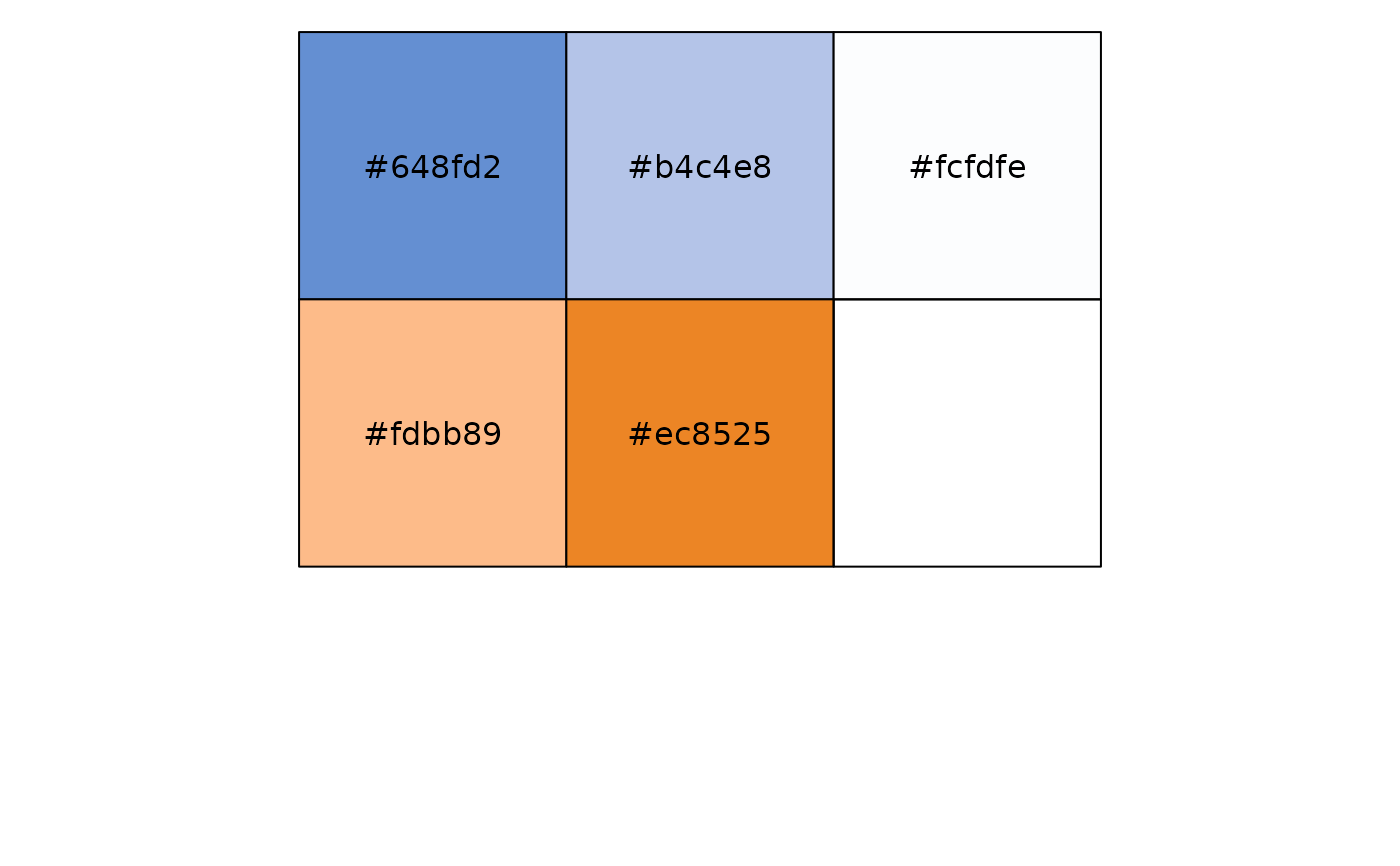
NumericNumber of different colours in the palette, minimum 3, maximum depends on the palette. Defaults to5. Ignored if name isaagi_colours.There are two (2) types of palettes provided, sequential and diverging.
Sequential palettes are suited to ordered data that progress from low to high. Lightness steps dominate the look of these schemes, with light colours for low data values to dark colours for high data values.
Diverging palettes put equal emphasis on mid-range critical values and extremes at both ends of the data range. The critical class or break in the middle of the legend is emphasized with light colours and low and high extremes are emphasized with dark colours that have contrasting hues.
The sequential palettes names are:
“aagi_BrYl”
“aagi_blues”,
“aagi_bright_greens”,
“aagi_greens”,
“aagi_greys”,
“aagi_reds”,
“aagi_oranges”,
“aagi_RdYl”,
“aagi_teals”,
“aagi_TlGnYl”,
“aagi_yellows”
All the sequential palettes are available in variations from 3 different values up to 11 different values.
The diverging palettes are:
“aagi_BuOr”,
“aagi_BuYl”,
“aagi_GnYl”,
“aagi_RdBu”,
“aagi_RdTl”,
“aagi_TlGn”,
“aagi_TlYl”
All the diverging palettes are available in variations from 3 different values up to 11 different values.
For qualitative palettes, the lowest number of distinct values available always is 3, but the largest number is different for different palettes. It is given together with the palette names in the following table.